Pendle (PENDLE) Outshines Major Coins with a 10% Rally as It Eyes More Gains

0
0


PENDLE has surged by 10% in the past 24 hours, making it the market’s top gainer during this period. The altcoin has even outperformed major cryptocurrencies like Bitcoin (BTC) and Ethereum (ETH).
With buying activity still underway, the PENDLE token is poised to extend its uptrend in the short term.
PENDLE Soars 43% After March Lows
PENDLE cratered to a seven-month low of $1.81 on March 11. As sellers got exhausted, the token’s buyers regained dominance and drove a rally. Trading at $3.24 at press time, PENDLE’s value has since climbed 43%.
The double-digit surge in the altcoin’s price has pushed it above the Leading Spans A and B of its Ichimoku Cloud indicator. They now form dynamic support levels below PENDLE’s price at $2.73 and $2.80, respectively.
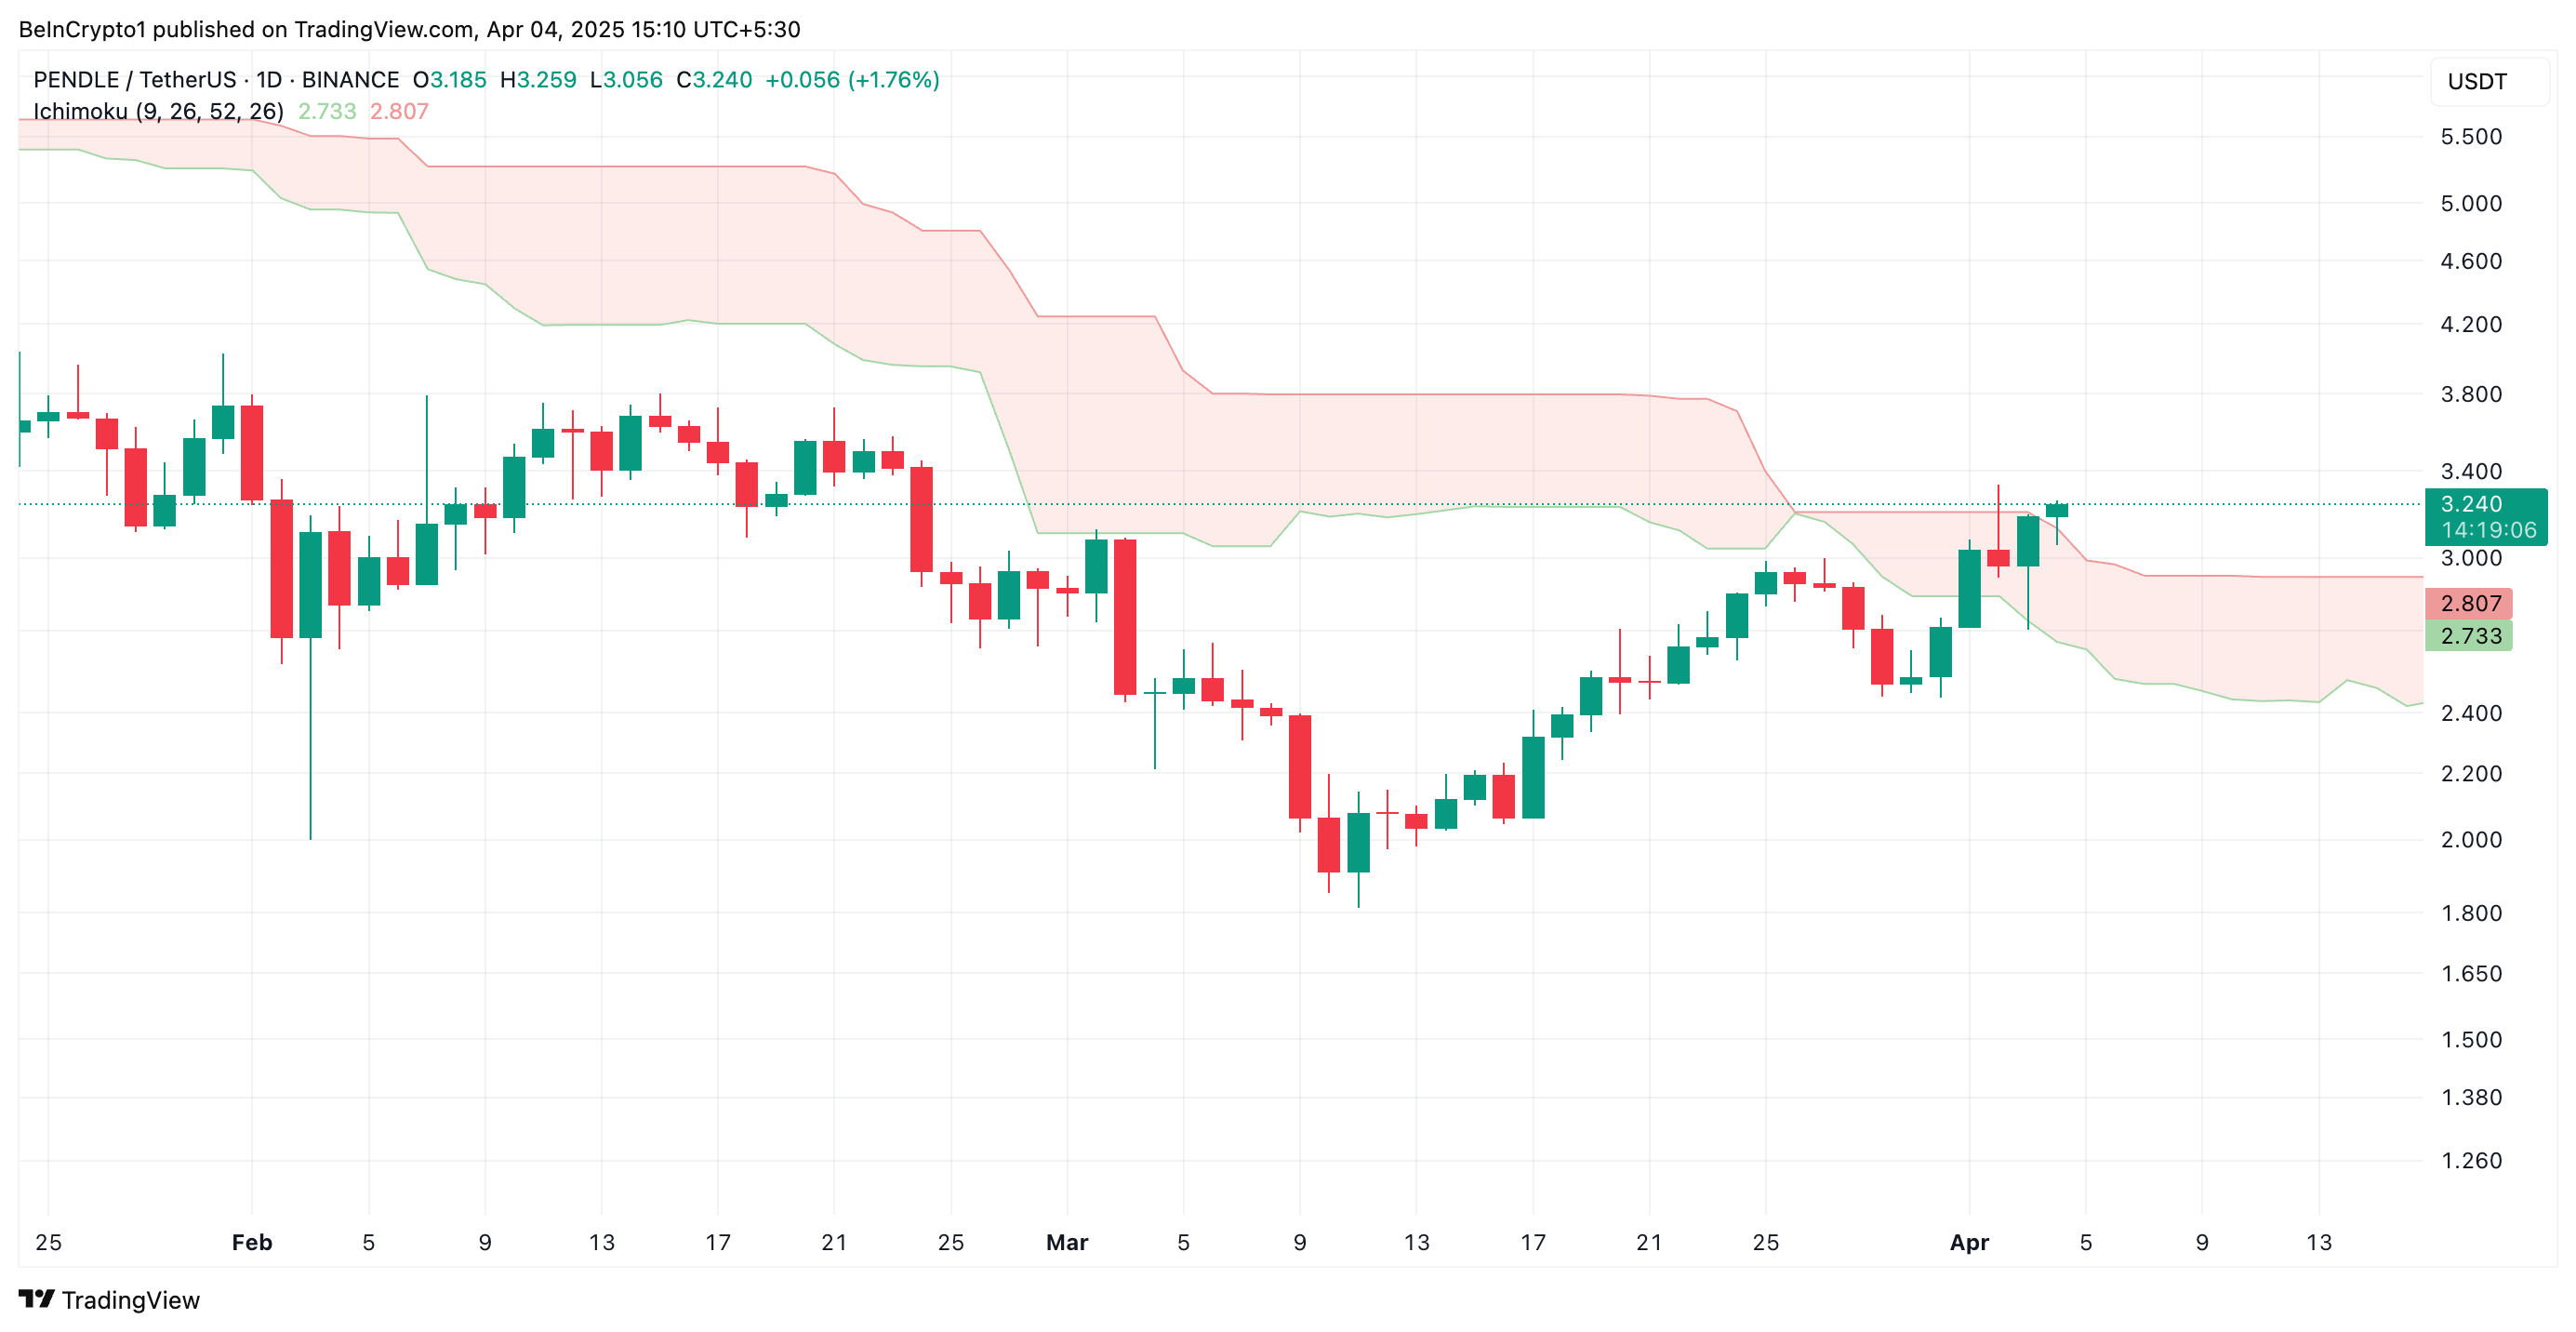 PENDLE Ichimoku Cloud. Source: TradingView
The Ichimoku Cloud tracks the momentum of an asset’s market trends and identifies potential support/resistance levels. When an asset trades above the leading spans A and B of this indicator, its price is in a strong bullish trend. The area above the Cloud is considered a “bullish zone,” indicating that market sentiment is positive, with PENDLE buyers in control.
This pattern suggests that the token’s price could continue to rise, with the Cloud acting as a support level if prices pull back.
In addition, PENDLE currently trades above its Super Trend indicator, confirming the likelihood of extended gains.
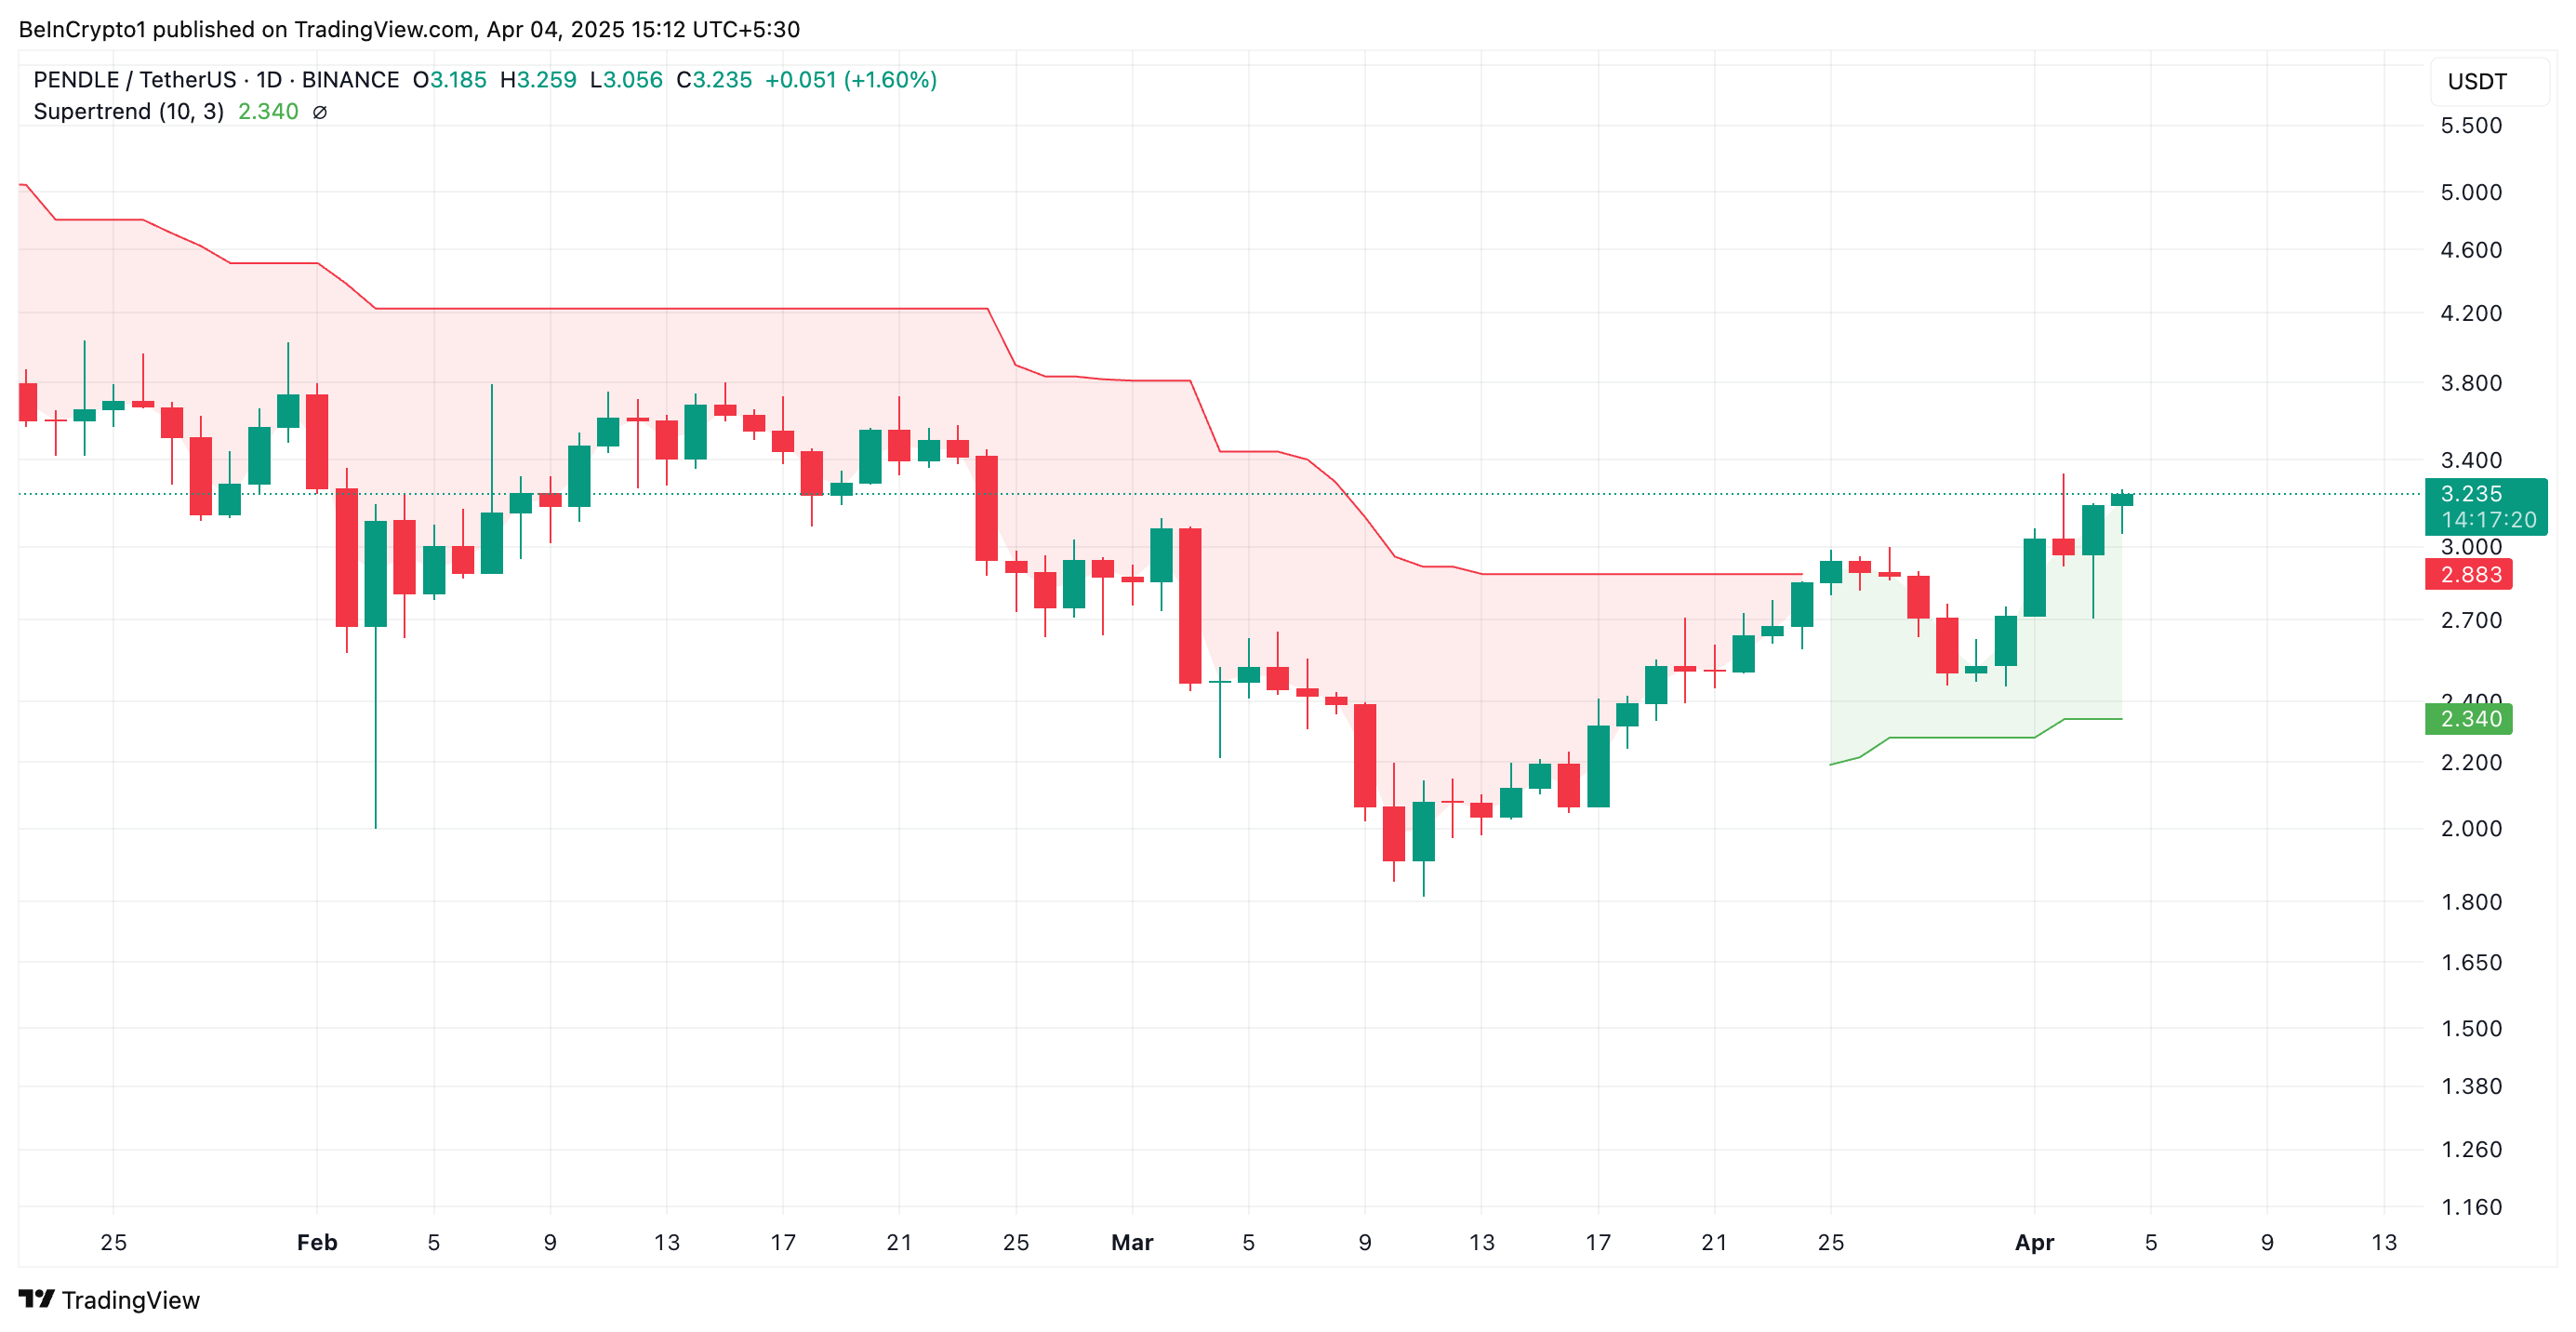 PENDLE Super Trend Line. Source: TradingView
The Super Trend indicator tracks the direction and strength of an asset’s price trend. It is displayed as a line on the price chart, changing color to signify the trend: green for an uptrend and red for a downtrend.
If an asset’s price is above this line, it signals bullish momentum in the market. In this scenario, this line represents a support level that will prevent the price from any significant dips. For PENDLE, this is formed at $2.34.
PENDLE Holds Above Key Trendline
Since its rally began on March 11, PENDLE has traded above an ascending trendline. This pattern forms when a series of higher lows connect, indicating that the price of an asset is consistently rising over time.
It represents a bullish trend, showing that PENDLE demand exceeds supply, with buyers pushing prices higher.
This trendline acts as a support level. With the token’s price bouncing off the trendline, it signals that the asset is in an uptrend and likely to continue. In this scenario, PENDLE could rally to $3.60.
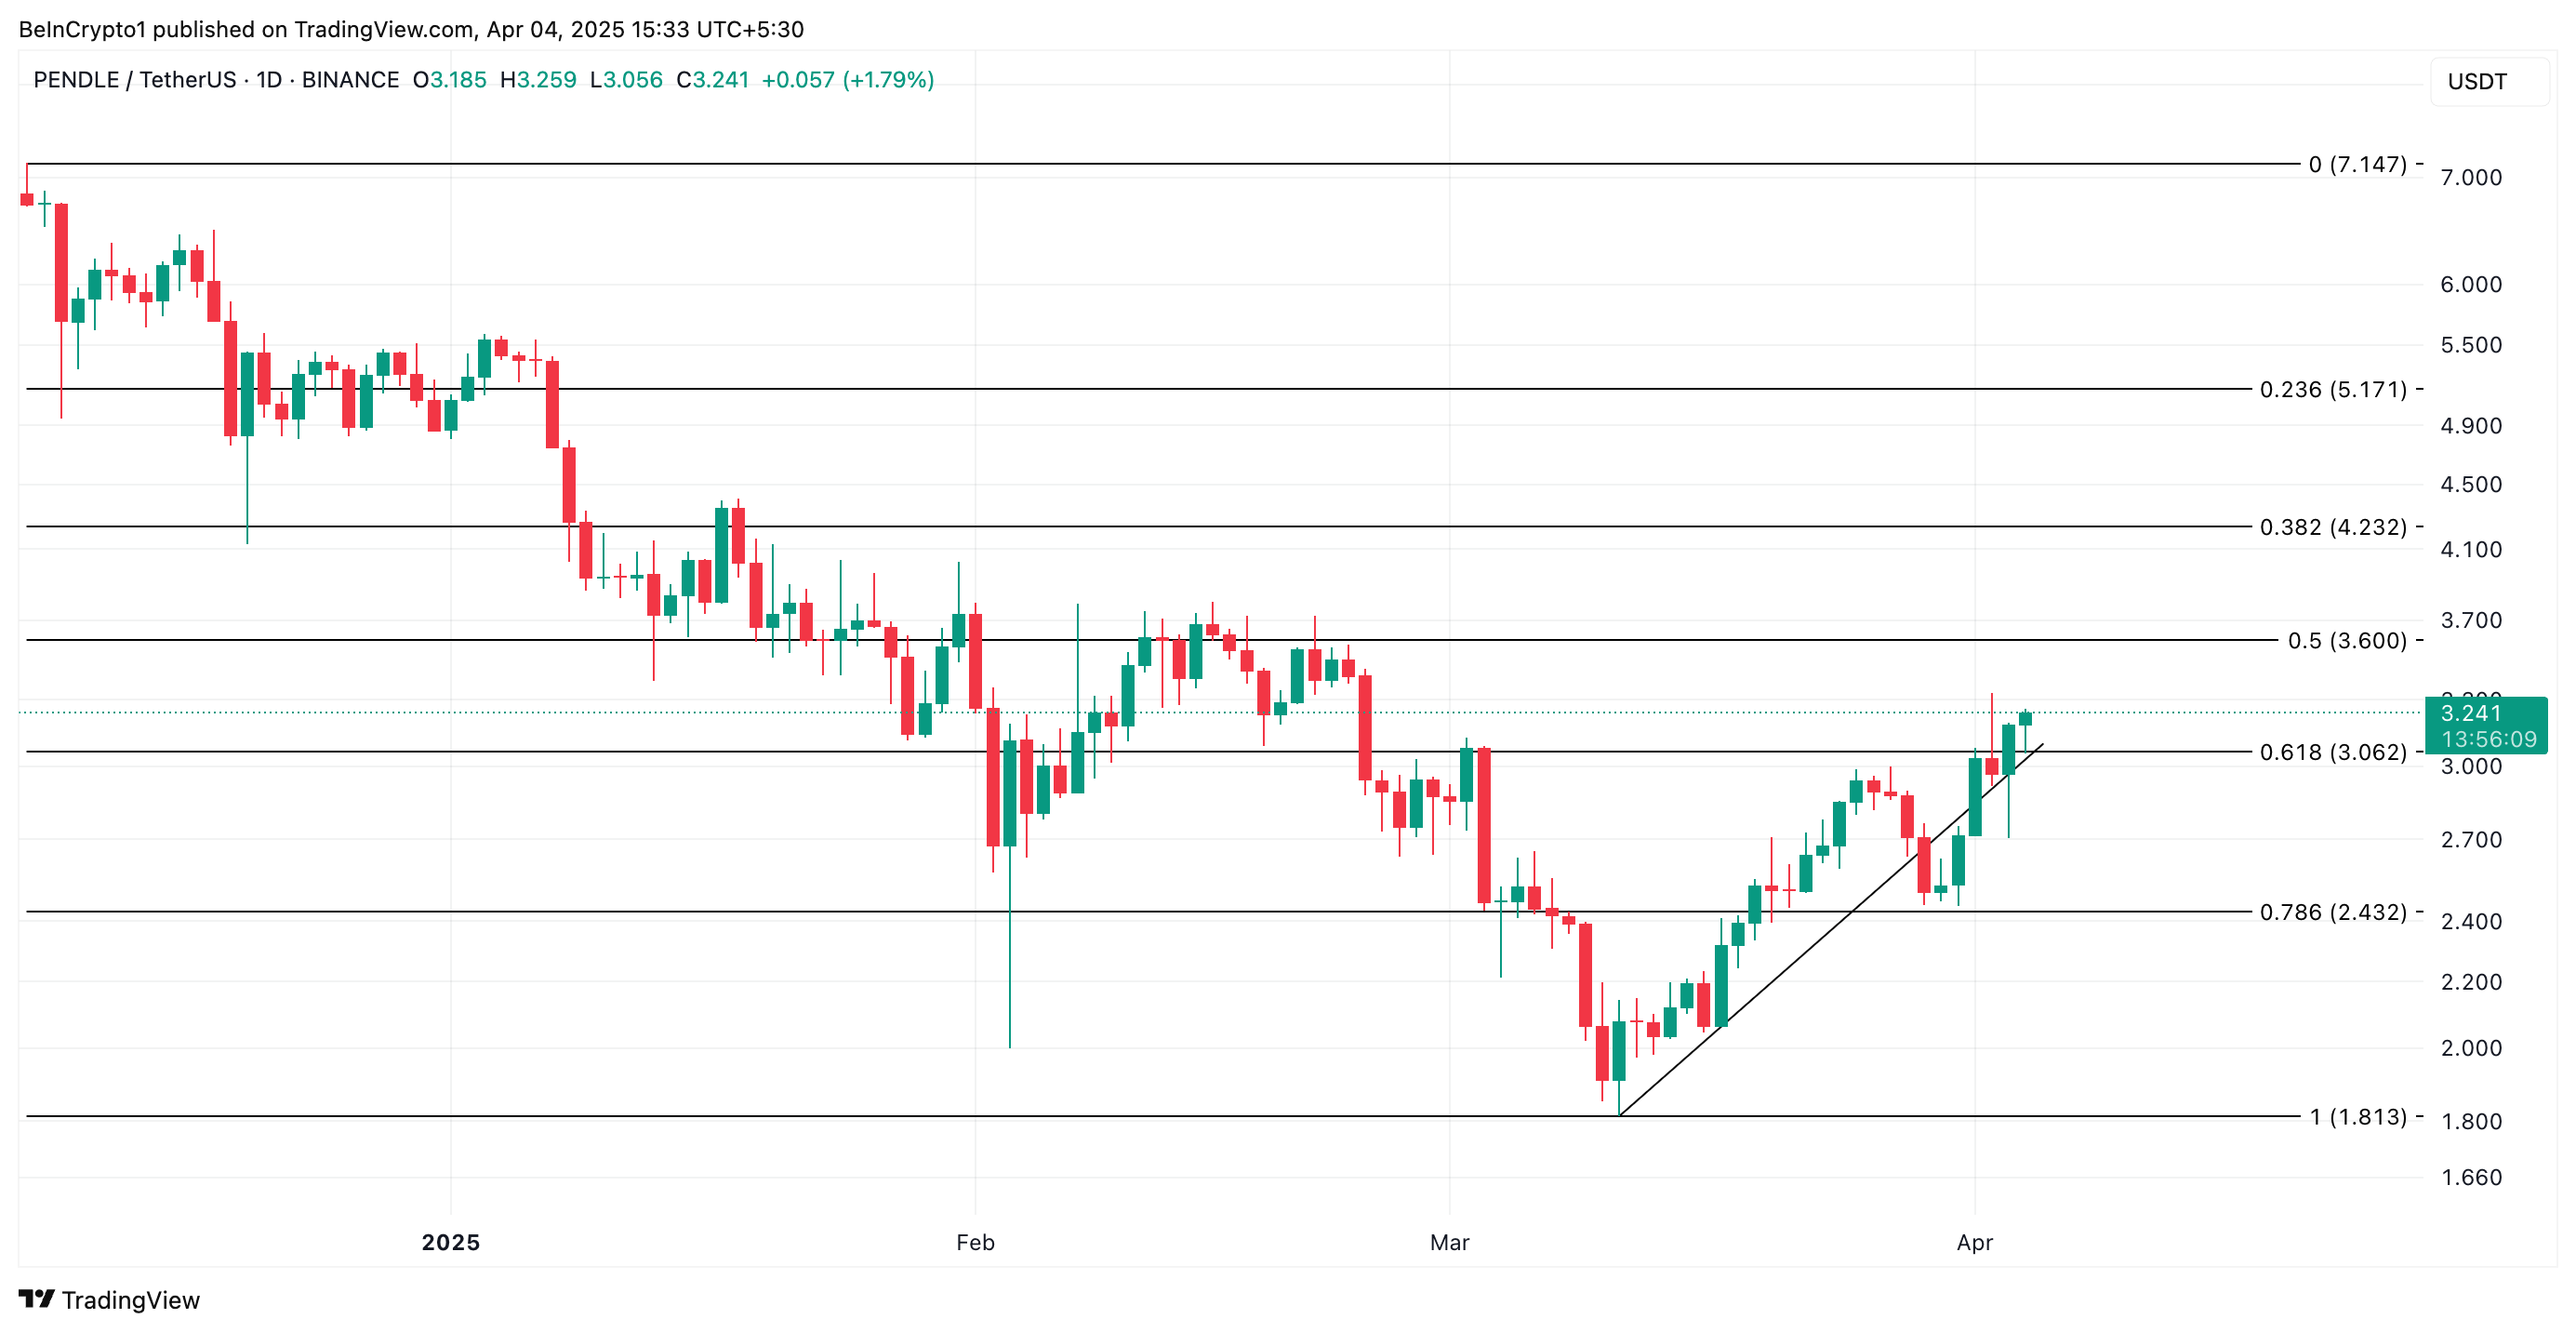 PENDLE Price Analysis. Source: TradingView
However, if selloffs commence, the PENDLE token could lose some of its recent gains and fall to $3.06.
0
0


 从同一位置管理所有加密资产、NFT 和 DeFi 资产
安全地关联您正在使用的投资组合,以开始交易。