PI Price Analysis of March 14, 2025: PI Fluctuates Between $1.80 and $1.60 – Is a Bullish Breakout Ahead?

1
0

Is PI establishing a trap for buyers or preparing for a breakout? The price has decreased from $1.80 to $1.66 or more, raising questions about what it will do next. We’ll look at the Pi price trend, resistance levels, and important technical indicators in this Pi price analysis. Traders are anxious to see if Pi price today can maintain its momentum or experience a significant pullback, given the conflicting signals from MACD and RSI. Is a reversal on the cards, or will bulls take over? Let’s examine the charts and determine what the information indicates should be PI’s next potential move!
PI Price Trend of March 13th: Holding Between $1.60 and $1.80 Amid Bearish Waves
The pi price saw notable swings yesterday, moving through important technical levels as traders responded to changing momentum. The trading session begins with a downward channel. A death appeared on the MACD indicator initially at 00:05 UTC, causing the pi price trend to follow a downward trajectory. This trend continued till an oversold condition indicated by the RSI indicator at 03:50 UTC changed the trend pattern by increasing buying pressure among traders.
This momentum was supported by a golden cross on the MACD indicator at 04:15 UTC, causing the price trend to rise. However, the prices kept fluctuating between $1.74 and $1.66 until an overbought RSI at 10:45 UTC and 11:00 UTC suggested a trend reversal as the market produced more selling pressure among traders. Fifteen minutes later, a death cross appeared at 11:15 UTC, causing the prices to fall in the trading range.
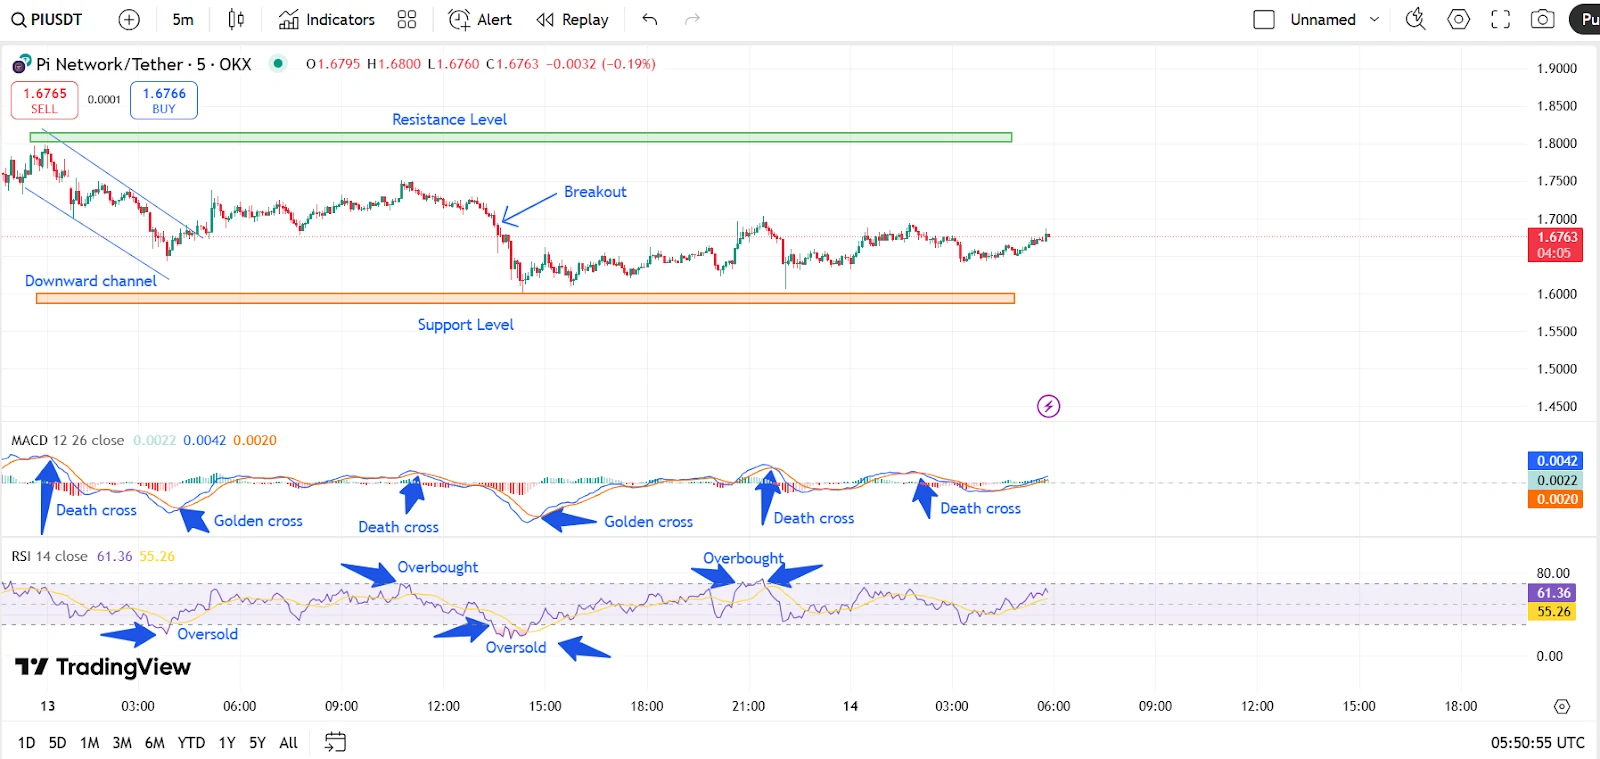
Chart 1, analysed by anushrivarshney2613, published on Tradingview
Based on PI price analysis, at 13:30 UTC, a breakout appeared with an oversold situation till 14:50 UTC, causing the price to find support at $1.60 and gradually marking the trend reversal. This was supported by a golden cross appearing at the same time, supporting the trend to continue an upward momentum. But overbought conditions at 20:45 UTC and 21:25 UTC, produced a strong selling pressure. Another death crossover at 21:45 UTC initiated a declining channel and increasing bearish pressure.
PI Price Analysis of March 14: Fluctuations Continued
Trading began on March 14 and showed no significant changes as investors reacted to the death cross formation in the previous session. The market of the pi price today faced further fluctuations in trading without making any potential changes in the pi price trend. A death cross formed on MACD at 02:00 UTC, announcing further market weakness. The next noticeable change appears when a price trend reversal or breakout occurs on the chart.
PI at a Turning Point – Will Bulls or Bears Take Control?
The PI market stands at a critical point because the price shows a similar trade pattern without any considering pointers. The MACD indicates bearish pressure through death crosses, but golden crosses signal recovery possibilities. The RSI indicates market confusion when it moves across overbought and oversold zones. Technical indicator signals are currently unclear so investors should wait for dependable evidence that will guide their strategic choices or next potential move.
The post PI Price Analysis of March 14, 2025: PI Fluctuates Between $1.80 and $1.60 – Is a Bullish Breakout Ahead? appeared first on Coinfomania.
1
0

 Tüm kripto, NFT ve DeFi varlıklarınızı tek bir yerden yönetin
Kullanmaya başlamak için portföyünüzü güvenli bir şekilde bağlayın.