Solana (SOL) Tanks 10% as Bears Tighten Grip: What’s Next?
0
0

Solana (SOL) is under heavy pressure, with its price down more than 10% in the last 24 hours as bearish momentum intensifies across key indicators. The Ichimoku Cloud, BBTrend, and price structure all point to continued downside risk, with SOL now hovering dangerously close to critical support levels.
Technical signals show sellers firmly in control, while the widening gap from resistance zones makes a near-term recovery increasingly difficult.
Solana Price Hits Yearly Low
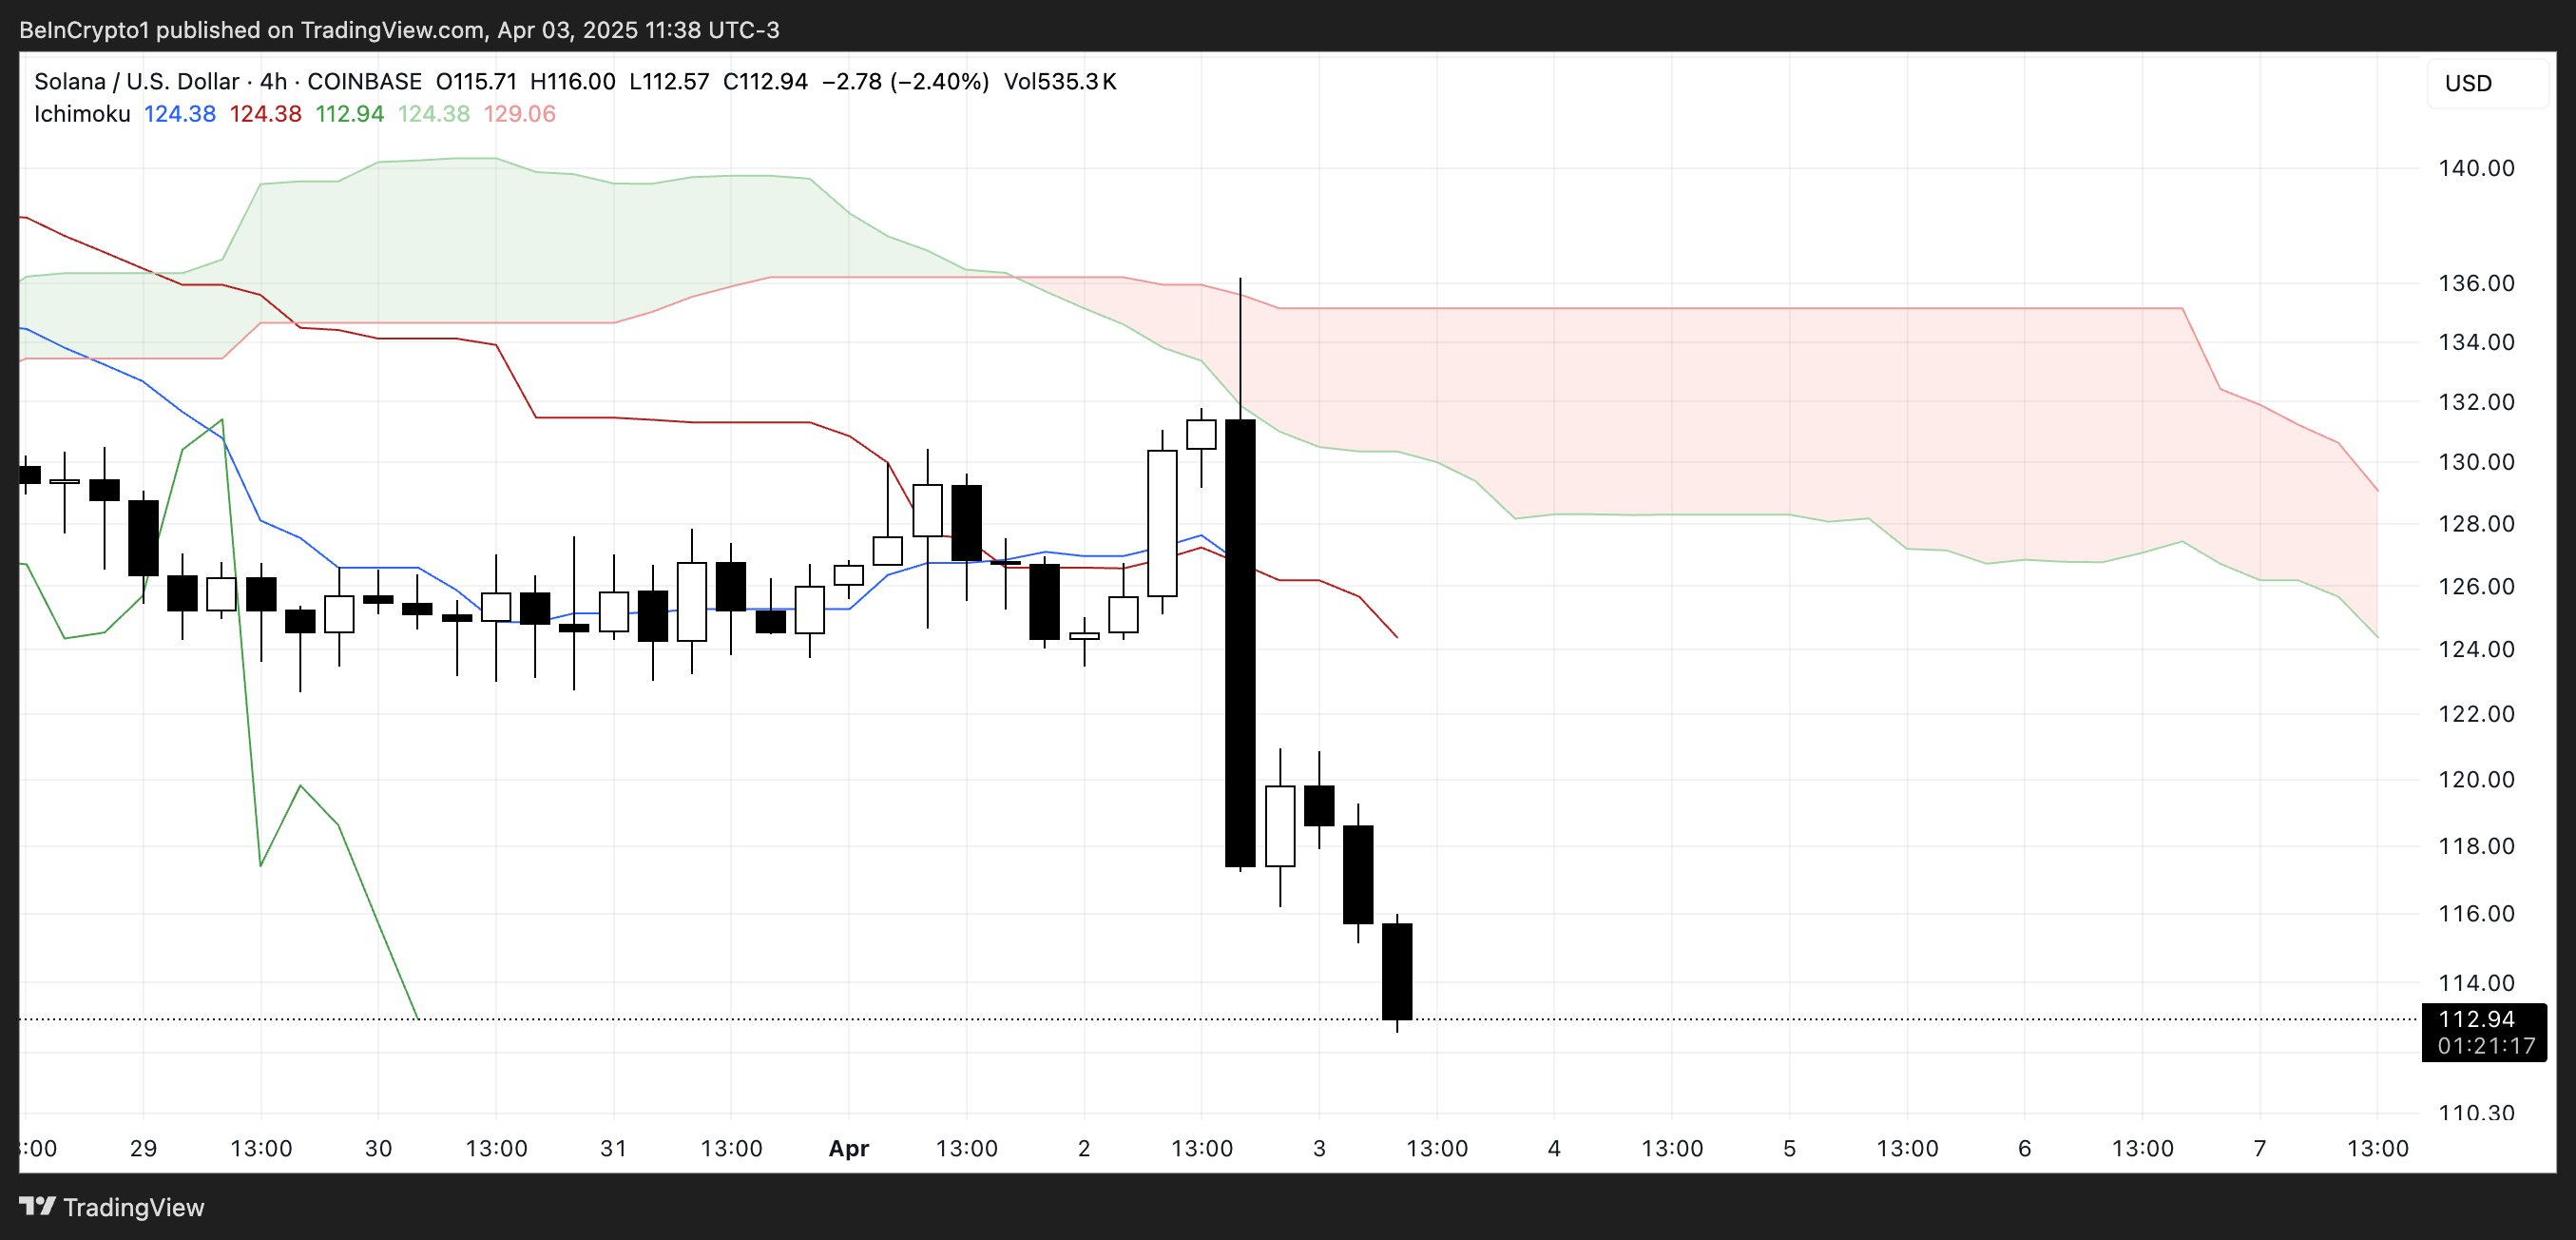
Solana’s Ichimoku Cloud chart is currently flashing strong bearish signals. The price has sharply broken below both the Tenkan-sen (blue line) and Kijun-sen (red line), confirming a clear rejection of short-term support levels.
Both of these lines are now angled downward, reinforcing the view that bearish momentum is gaining strength.
The sharp distance between the latest candles and the cloud further suggests that any recovery would face significant resistance ahead.
 SOL Ichimoku Cloud. Source: TradingView.
Looking at the Kumo (cloud) itself, the red cloud projected forward is thick and sloping downward, indicating that bearish pressure is expected to persist in the coming sessions.
The price is well below the cloud, which typically means the asset is in a strong downtrend.
For Solana to reverse this trend, it would need to reclaim the Tenkan-sen and Kijun-sen and push decisively through the entire cloud structure—an outcome that looks unlikely in the short term, given the current momentum and cloud formation.
Solana’s BBTrend Signals Prolonged Bearish Momentum
Solana’s BBTrend indicator currently sits at -6, having remained in negative territory for over five consecutive days. Just two days ago, it hit a bearish peak of -12.72, showing the strength of the recent downtrend.
Although it has slightly recovered from that low, the sustained negative reading signals that selling pressure remains firmly in control and that the bearish momentum hasn’t yet been reversed.
The BBTrend (Bollinger Band Trend) measures the strength and direction of a trend using Bollinger Bands. Positive values suggest bullish conditions and upward momentum, while negative values indicate bearish trends.
 SOL BBTrend. Source: TradingView.
Generally, values beyond 5 are considered strong trend signals. With Solana’s BBTrend still well below -5, it implies that downside risk remains elevated.
Unless a sharp shift in momentum occurs, this persistent bearish reading may continue to weigh on SOL’s price in the near term.
Solana Eyes $112 Support as Bears Test February Lows
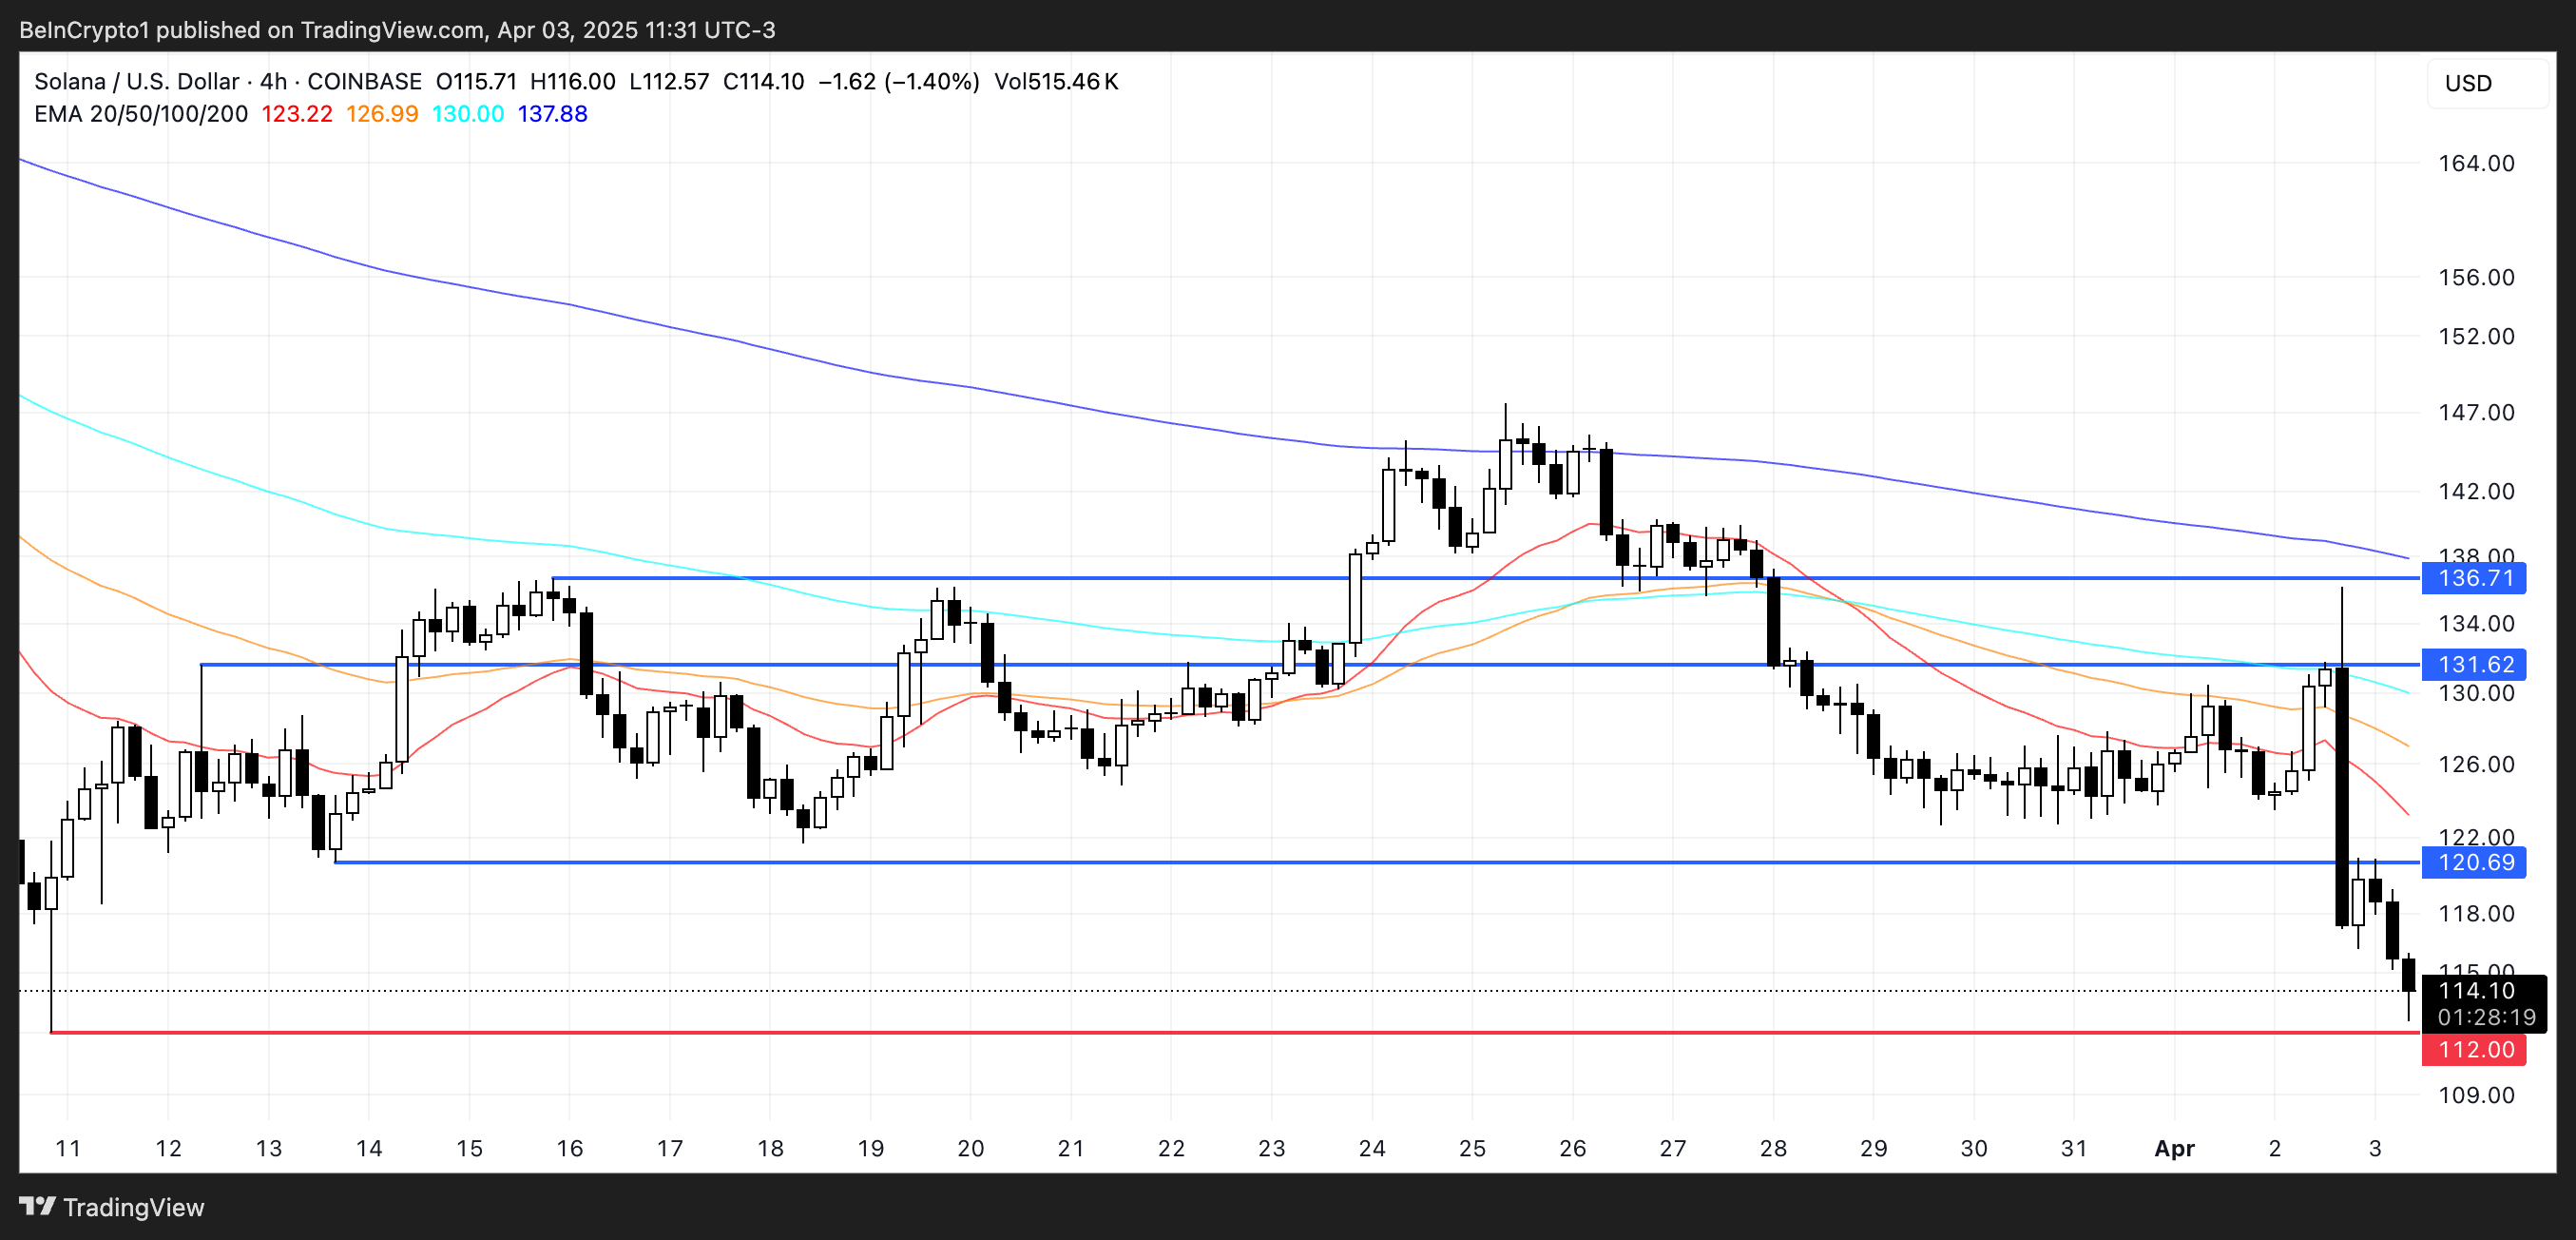
Solana’s price has broken below the key $115 level, and the next major support lies around $112. A confirmed move below this threshold could trigger further downside. That could potentially push the price under $110 for the first time since February 2024.
The recent momentum and strong bearish indicators suggest sellers remain in control, increasing the likelihood of testing these lower support levels in the near term.
 SOL Price Analysis. Source: TradingView.
However, if Solana manages to stabilize and reverse its current trajectory, a rebound toward the $120 resistance level could follow.
Breaking above that would be the first sign of recovery, and if bullish momentum accelerates, SOL price could aim for higher targets at $131 and $136.
0
0
 Manage all your crypto, NFT and DeFi from one place
Securely connect the portfolio you’re using to start.


