Can Bitcoin Approach $100K All Over Again?

0
0


NAIROBI (CoinChapter.com) — Bitcoin (BTC) hovered near $84,500 on April 14 after reclaiming a key resistance zone. The daily close above $83,000 has kept bullish hopes alive, with some traders predicting a swift push to $88,000 or higher if momentum holds.
At the time of writing, the benchmark cryptocurrency traded at around $84,500, with a modest 0.89% intraday gain. Price action remained just below the 50-day and 200-day exponential moving averages, which both converged near $85,500.
Bitcoin $85K Resistance Zone Faces Renewed Pressure
Bitcoin appears to be testing the upper trendline of a descending channel that has contained the price since late February. The area between $85,000 and $86,000 remains a heavy resistance block. On-chain analyst Ali flagged $86,000 as a critical zone. A breakout above it, he said, might open the path to $97,000.
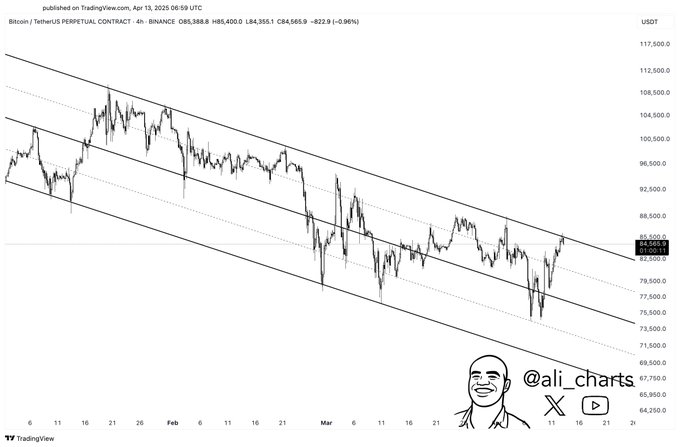
Meanwhile, analyst Friedrich noted that bulls are “trying to save 83–84K.” If they succeed, he added, the move toward $88K–$92K “will come quick.”

However, the market has not yet cleared overhead selling pressure. The 1.618 Fibonacci extension level from the Nov. 2024 breakout points to $105,820 as a potential longer-term target—though only if the current structure confirms upside continuation.
Inverse Head & Shoulders Structure in Play
While price inches higher, some traders warn of a looming shakeout. Ali Martnez proposed a “pump to $97,000,” designed to fuel complacency. Others echoed this sentiment, suggesting the rally could stall just below $88,000.
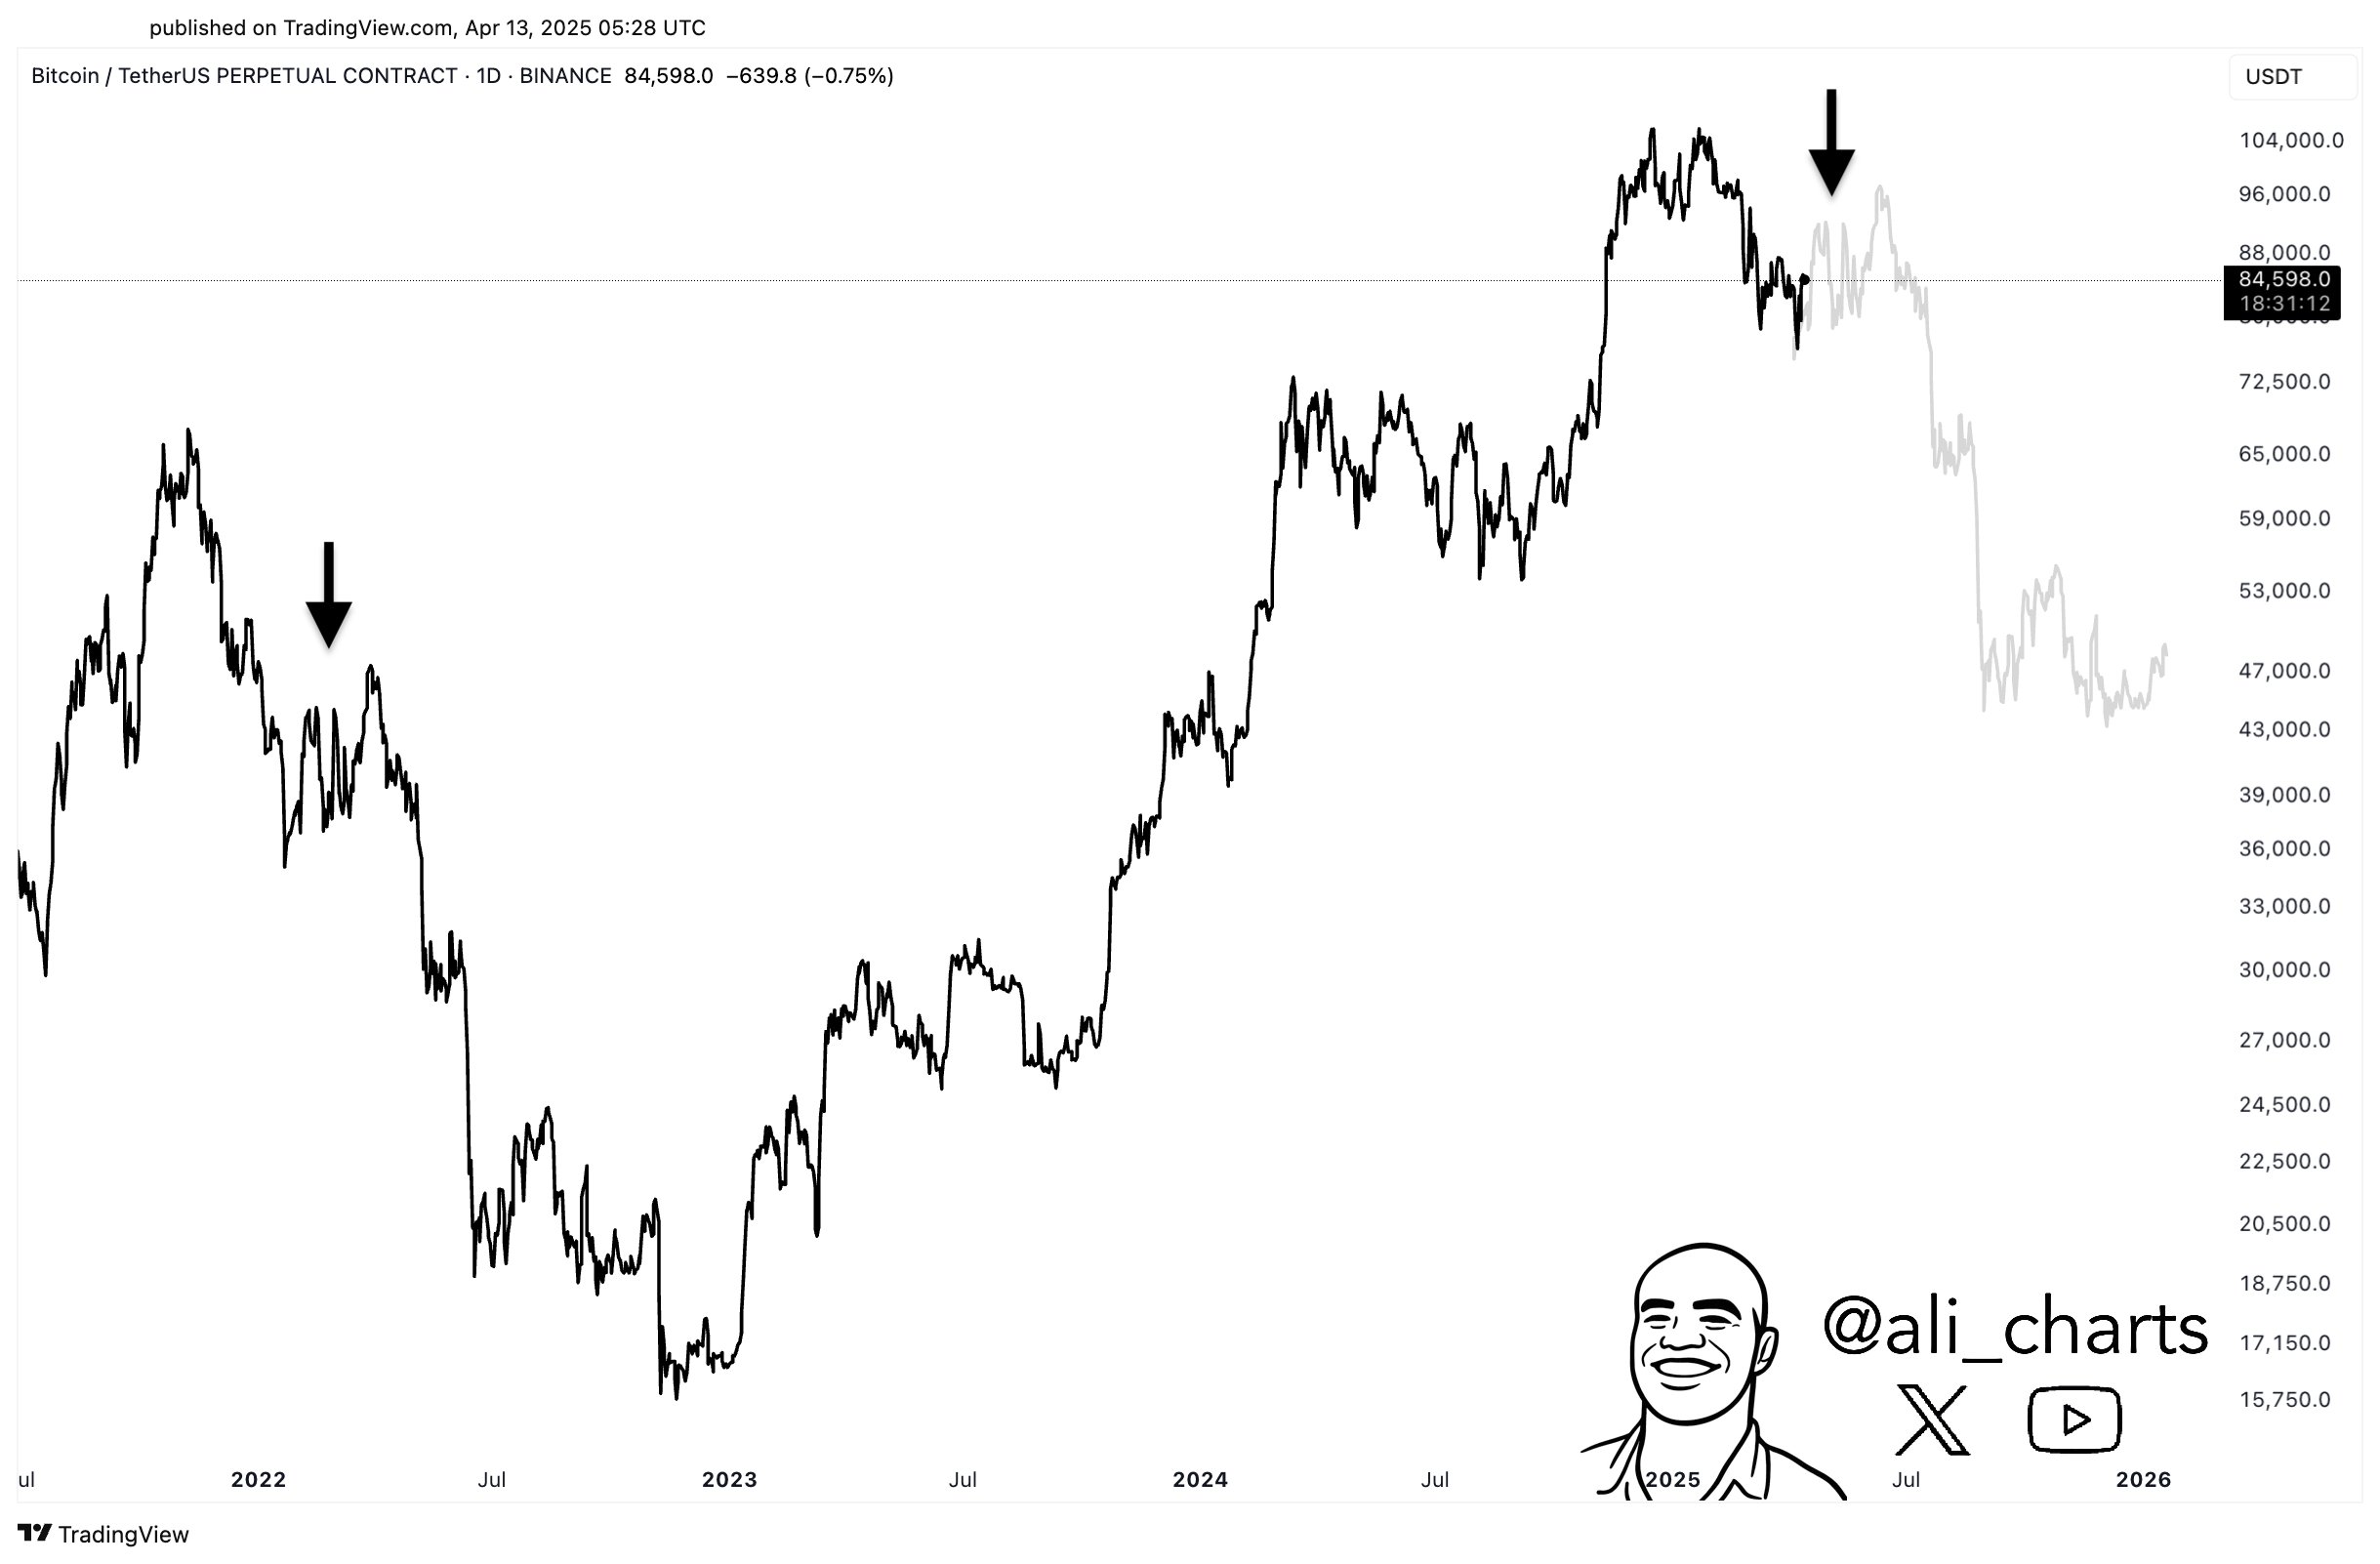
Ak47 suggested a false breakout may be underway. In a recent post, he argued that “$BTC might push to $88K—but don’t get too comfy,” hinting at a potential liquidity grab. If prices pull back to $81,000, he added, it could “form an inverse head and shoulders setup.”

This scenario may pave the way for a larger breakout targeting $95,000–$100,000.
Binance Whale Flows Suggest Accumulation, Not Capitulation
New on-chain data from market observer Darkfost offered insight into whale activity on Binance. He examined two metrics: the Exchange Whale Ratio and Binance Whale-to-Exchange Flow.

The Exchange Whale Ratio’s 365-day moving average has trended higher, signaling consistent long-term whale involvement. However, the 30-day average has dropped back to levels last seen in September–October 2024. This suggests short-term selling pressure may be easing.
The 30-day Binance whale inflow value also declined by over $3 billion, mirroring inflows during the 2024 correction. According to Darkfost, this implies whales are “not panicking” but are rather stepping back from active selling, opting to hold through macro uncertainty.
$83K Support Holds, $86K Resistance Key for Momentum
Bitcoin has also held the $83,000 level for several sessions despite multiple attempts by bears to break it. Data from TradingView shows BTC bouncing from $83,664 during Sunday’s Asian session, with bulls defending the zone against downward pressure.
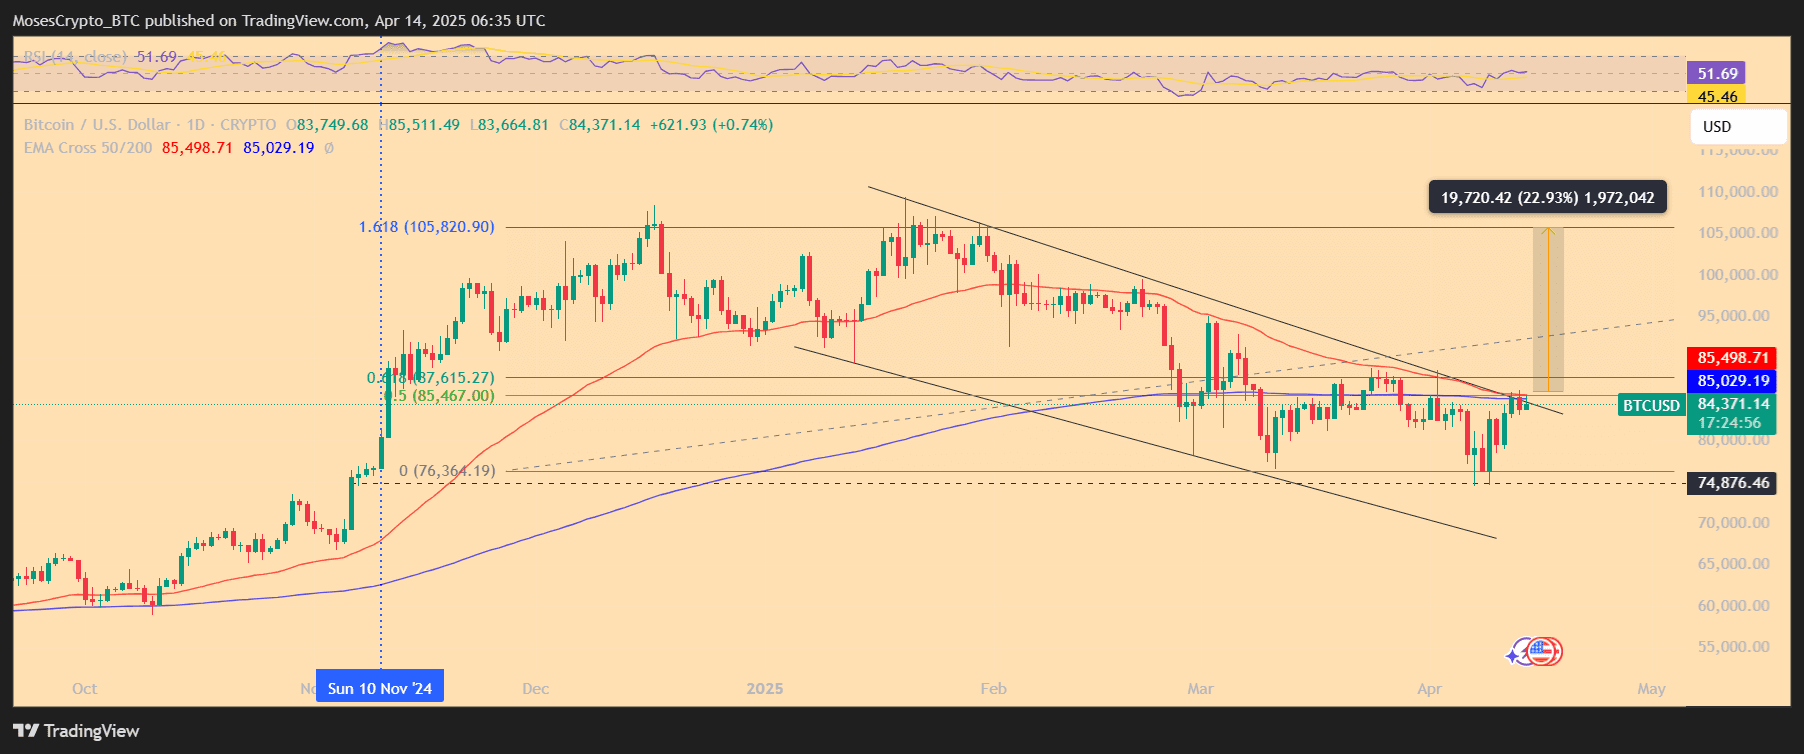
The $81,000–$83,000 region remains key support. A break below could expose BTC to a retest of the March low at $74,876.
On the upside, a confirmed move above $86,000 would invalidate the descending pattern and open the door to $88,000–$97,000.
Bitcoin price action remains range-bound. But decreasing whale inflows, coupled with critical resistance tests, point to a high-stakes week ahead.
0
0

 Manage all your crypto, NFT and DeFi from one place
Securely connect the portfolio you’re using to start.


0
0
