Cardano (ADA) Plunges Below $0.65, Becomes Worst-Performing Top 10 Altcoin Amid Trump’s Tariff Shock

0
1


Cardano (ADA) has fallen below the key support level of $0.66, marking one of its weakest performances in recent months. The altcoin is now trading at $0.6570, recording a daily decline of 2.69% and a weekly loss of over 11.68%. The total crypto market capitalization currently stands at around $2.68 trillion, showing only a modest 0.44% daily gain. Bitcoin dominance remains intact, but altcoins are clearly under pressure.
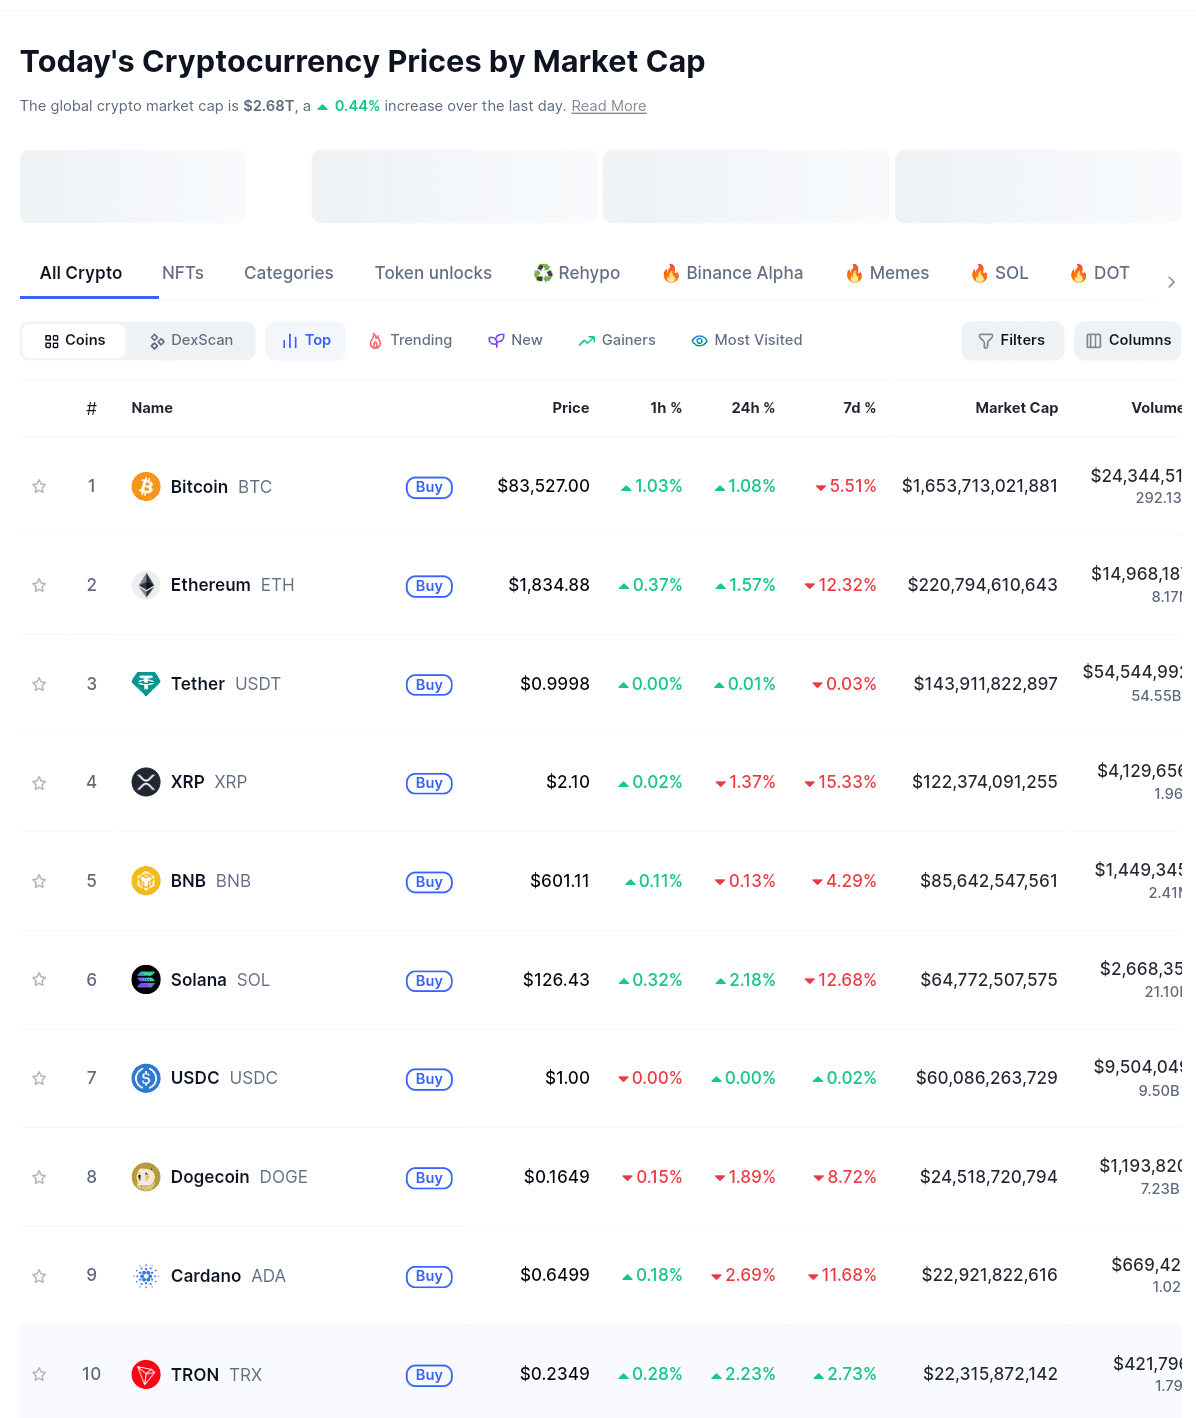
The current downturn in ADA’s price is not happening in isolation. The total crypto market capitalization currently stands at around $2.68 trillion, showing only a modest 0.44% daily gain. Additionally, the most leading altcoins like XRP and Ethereum posted double-digit losses on a weekly basis. Bitcoin has declined by 5.51% over the past week, while Ethereum has fallen by 12.32%. Solana, another altcoin, is down by 12.68%. However, Cardano’s 11.68% weekly loss makes it one of the most heavily affected assets among the top ten.
President Trump’s reciprocal tariff has become a major source of uncertainty for investors across all asset classes. The policy aims to impose duties on foreign goods equivalent to the tariffs those countries place on U.S. exports. This has heightened concerns about a potential slowdown in global trade and economic activity.
Technical Breakdown Confirms Bearish Sentiment
Cardano’s price action has been under pressure since mid-March when it first struggled to stay above the $0.70 psychological support. In recent days, the price has consistently failed to recover, and now ADA is firmly trading below the $0.66 mark.
According to technical data, ADA remains below its 200-day Fibonacci-based Band (FBB), which is positioned near $0.8474. This long-term indicator is often seen as a critical resistance zone by traders. The inability to break above this level is reinforcing the bearish trend.
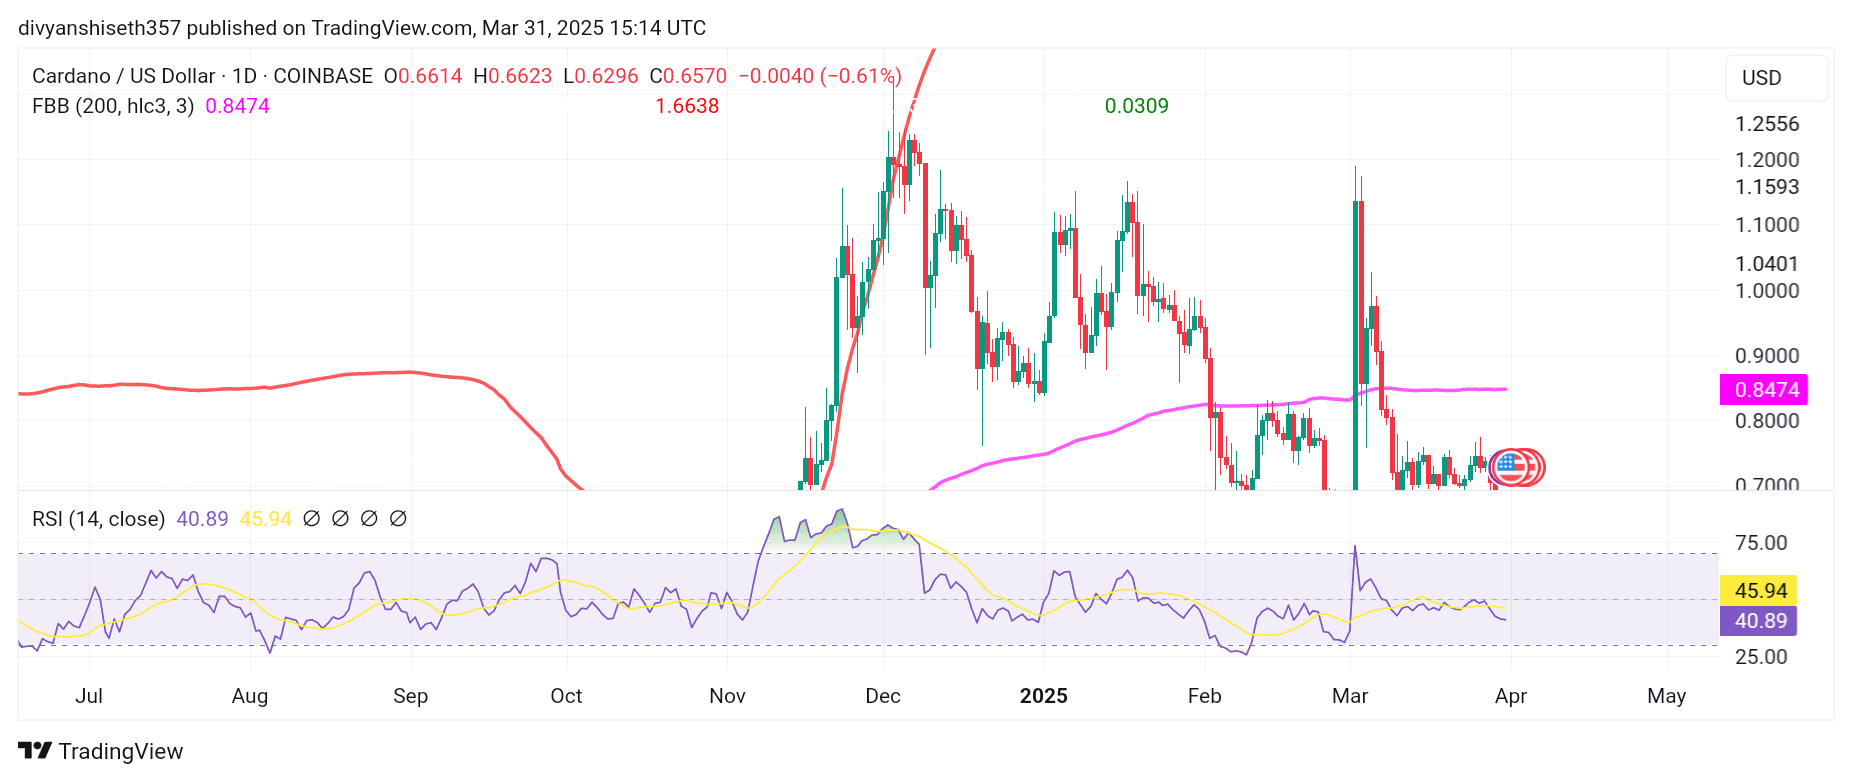
The Relative Strength Index (RSI) — a key momentum indicator — is currently reading around 40.89. An RSI below 50 generally suggests that sellers are dominating the market. In ADA’s case, the RSI consistently staying near or below 40 signals weak buyer interest and a possible continuation of the downward trend.
Can ADA Defend the $0.60 Support?
Trading volume further confirms the bearish sentiment. In the past 24 hours, Cardano’s trading volume stood at approximately $669 million. This figure is notably lower compared to Solana’s $2.66 billion and XRP’s $4.12 billion during the same period.
Lower trading volumes during periods of price decline generally indicate that fewer buyers are stepping in to absorb the selling pressure. This situation leaves the market vulnerable to more severe pullbacks as even moderate selling can push prices lower.
With ADA now trading firmly below $0.66, the next critical support seems to be $0.60. If Cardano fails to hold this level, further losses could occur, possibly leading to a retest of lower zones not seen since late 2023.
0
1

 すべての暗号通貨、NFT、DeFiを1か所から管理
開始に使用しているポートフォリオを安全に接続します。